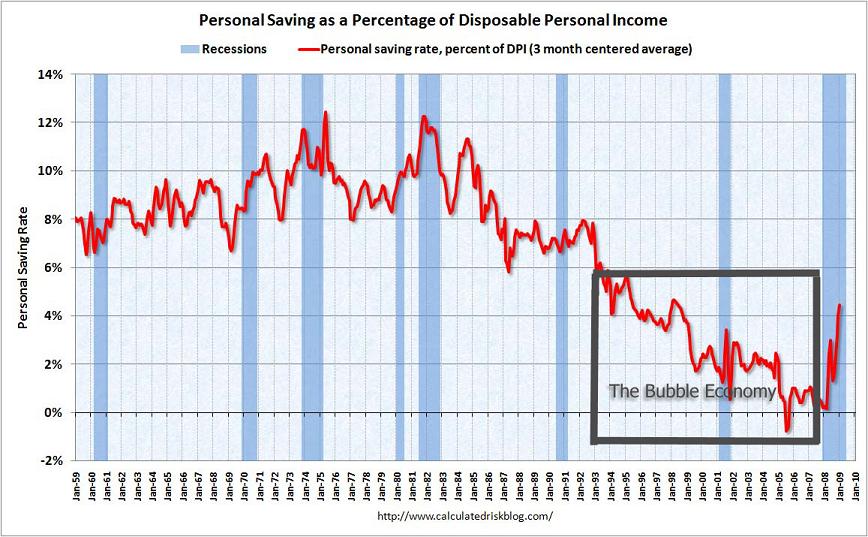
If you want to see why the economy is such a mess and why the bear market isn’t over, look at the “Personal Saving” chart. It shows the percentage of income that U.S. consumers have been spending over the past four decades. (The statistics for Canada and other Western countries follow a similar pattern). Before 1993 (when people hadn’t taken leave of their financial senses) the average consumer saved from six to twelve percent of their disposable income. Then between 1993 and 2006 the savings rate plummeted. Thirteen years of reckless and unrestrained binge-borrowing and consumption. People maxed out their credit cards and then some. They kept up with the Jones’ and Jones himself went nuts. It was an unsustainable Bubble Economy, a hollow prosperity built on a pyramid scheme of shaky debt. By 2005, the U.S. savings rate was negative (so was Canada’s). This was a horrendous development. Why bother saving when you could use your house as an ATM? Why bother when you could get a six-figure mortgage even if you couldn’t pay it off? The reckoning did not take long, the real-estate bubble in the U.S. began its collapse in 2007 and the global economy has tanked.
The most dangerous time to be in the stock market (or the real estate market for that matter) is when the majority has embraced the comforting illusions of easy wealth. Those illusions have been shattered. People are scrambling for higher ground as the tidal waves of recession wash away the fortunes of the imprudent. You can literally read the fear from the savings chart. Over the past few months the savings rate has soared to over 4%.
Why things are likely to get worse
This new-found frugality adds yet more force to the downturn. Car sales have fallen to multi-decade lows. Appliances and PC sales, you name it, everything is down. Now here’s the key point: The 4% savings rate is still too low. Look at the savings rate during the 1973-74 recession and the 1981-82 downturn. Historically during deep recessions, savings rates soar to over 12%. If we’ve taken this much damage with a 4% savings rate what will happen to the economy when we’re at a savings rate of 10 or 12%?
The U.S. economy has already shed 650,000 jobs for three straight months, the worst decline in percentage terms over that length of time since 1975. Approximately 15% of the U.S. workforce is either unemployed, underemployed or have given up looking for work Here in Canada, unemployment rates are beginning to follow the same upward trend. For many living paycheck to paycheck the only way to avoid the nightmares of job loss, foreclosure and bankruptcy is yet more belt-tightening.
Despite the talk by economists of stimulating the economy, there is no easy way out. Bailing out banks or spending money on infrastructure simply moves the debt from one place (i.e. private sector) to another (i.e. government). These measures will soften the sharpness of the decline but it doesn’t address the fundamental issue. For things to get better, consumers and businesses must rebuild their wealth. Given the treachery of the stock market and the real estate market, only the old-fashioned way remains – savings. The bad news is that it’s going to take years to dig out of the hole. The overconsumption of the past decade brings with it a bitter legacy. Put bluntly, we’ve got too much stuff. Just to take one example, there are thirty million excess houses in the U.S. real estate market. What will that do to struggling mortgage-holders who are looking for rising prices to bail them out? The credit crisis isn’t over by a long shot.
The most important thing you should know about the Nikkei Crash
Let’s talk about the stock markets. With the S&P 500 index down fifty percent from its high, the Great Decline of 2007-8 is already worse than the Crash of 2001 and the 1973-74 Oil Crisis. The only major bear markets in Western economies that were worse? The Crash of 1929 and yes, the Nikkei Crash of 1990.
Readers of my previous columns may remember that I consider the Nikkei Crash as a plausible (but not inevitable) model for what’s to come. (see “The Great Decline” column from September 2006 reprinted at www.legadoassociates.com as well as other previous articles). The American real-estate bubble and banking crisis is remarkably similar to the Japanese experience of the 1990s. After a decade of runaway speculation, Japan’s Nikkei stock market suffered a cataclysmic incineration of investor wealth. While we are used to thinking of economic cycles (“it’ll come back eventually”), what happened in Japan was extraordinary. Their economic cycle got flattened. Car sales in Japan have plummeted by half since 1990. Residential real estate values are off by fifty percent; commercial real estate is even worse – down by over sixty percent. These problems would normally drive people to drink but even that consolation is no longer affordable. Sales of whiskey are one-fifth of what they were in the boom years.
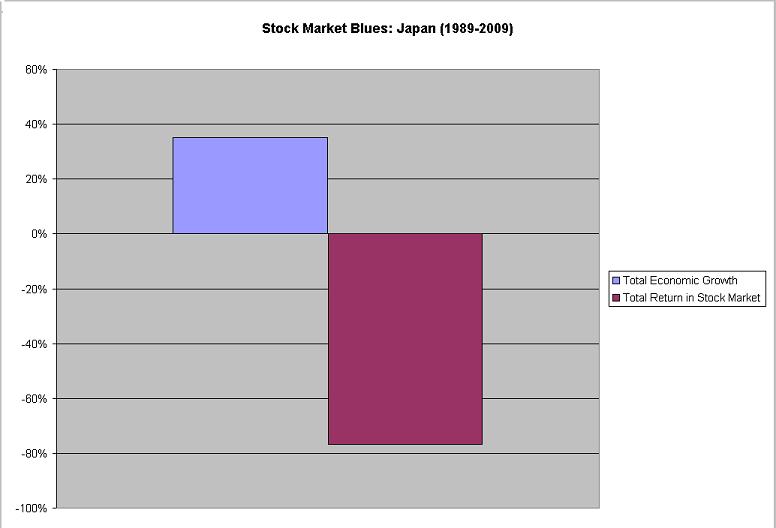
What’s the most important thing to learn from the Nikkei Crash? No doubt you’ve read much in the press about when the economy will “turn around”. The implication is that when the economy starts growing again, the stock market will follow.
Take a look at the Stock Market Blues chart. It’s the story of Japan from 1989 to 2009. Conventional wisdom has it that stock markets go up when the economy recovers. In the case of Japan, conventional wisdom was dead wrong. Japan’s economy is about 35% bigger now than it was twenty years ago. You would think that with all that growth, the stock market would have had time to recover from the crash of the Nineties. But instead it is still down by over 75%. What happened? The Japanese have been doing exactly what we’re starting to do today. They’ve been paying off their debts and rebuilding their savings out of the rubble of the collapse. It’s been twenty years and they still haven’t tunneled out yet.
How similar is our downturn to Japan's?
Although I consider the Nikkei bear market as a possible scenario, I don’t expect an identical replay. Bear markets are like storms. Each has its own particular duration, severity and velocity. Let’s take a look at why we might expect our bear market to be better or worse than theirs.
On the optimistic side:
- Demographics – Japan has aged a lot faster than Western countries. Older folks don’t spend as much and that may account for the depth of their recession.
- Culture – Japan has embraced frugality with a vengeance. It is common practice to wash laundry in bath water. Will Westerners become as thrifty? Belt-tightening is necessary to restore our balance sheets, but going too far carries its own dangers.
- Policy mistakes – some argue that the Japanese government needlessly extended their recession by not cleaning up their financial system quickly enough through write-offs of bad loans and closing bad banks. Perhaps we can avoid their mistakes.
On the negative side, here’s why we might expect things to be as bad or worse:
- The Nikkei collapse happened in a decade when the global economy was thriving. The Japanese economy was buoyed up by exports to the rest of the world. In today’s downturn, there’s no-one to help us out. The U.S. was not alone in its financial excesses. In the U.K. for example, real estate prices were driven to unsustainable levels. European banks have lent billions of euros to Eastern European countries, many of which are now in desperate straits (e.g. Latvia, Lithuania, Estonia and Romania). In China, loans to the construction industries and export businesses are in trouble.
- It’s unclear whether the Obama administration is doing enough to restore US banks to health.
- The numbers on unemployment, housing prices and foreclosures have gotten steadily worse with no sign of an early end to the damage.
How things will work out in real life is of course unknown. You can argue both sides of it. What you shouldn’t do though is play make-believe and say that a multi-decade decline can’t happen. It can happen because it has happened. Give uncertainty its proper due. Factor in the possibility of such an outcome in your portfolio allocation.
Where’s the bottom?
In Canada, we have seen dramatic delines in the TSX although we are still not hitting multi-year lows like the U.S. Still, it’s too early to sound the all-clear. Recent articles in the media, for example, have lauded the prudence of our Canadian banks. I can only say that you don’t find out how good your roof is until after the hurricane strikes. Real estate prices have only just begun to fall in Canada. We won’t know how strong our banks are until a year or two from now. I expect real-estate to fall over 30% in most major Canadian cities. How severe will the banks’ losses be when the foreclosures start increasing? It’s hard to know, but the high dividends on Canadian bank shares are there for a reason. If you’re going to buy shares of the Big Banks, do so with a plan to buy more at cheaper prices. The good news is that we don’t have as many subprime mortgages as the Americans. The bad news is that in a severe economic downdraft even good creditors run into trouble.By the end of the year we could see both the TSX and the Dow hit 5000. There’s a smaller but still substantial chance that these indices will fall to 3000 before the end of 2010. This is not meant to frighten you, quite the opposite. If you are prepared for such eventualities, fear disappears. I can’t emphasize this enough: The key to successful investment in this climate is to acclimatize yourself to bad news without at the same time becoming blind to risk. You need to be able to take advantage of bargains as they appear but be aware that even bargains can get cheaper.
Calling a market bottom is a mug’s game but there are ways to make better guesses. The savings rate can give us a clue. If it approaches double digits as it did in previous recessions, then a bottom may be close at hand. But there’s a caveat. If unemployment worsens sharply, the savings rate may start falling again (as consumer income falls). The last time this happened during a downturn was in the depths of the Great Depression in 1932 and 1933. Official doctrine holds that this is unlikely today because of our social safety nets. Hopefully the officials are right. If they are wrong, the bottom will be much more traumatic and will be marked by negative savings and simultaneous sharp drops in consumer spending.
Picture Credit: Personal Savings graph reproduced with permission from www.calculatedriskblog.com. Annotation of "Bubble Economy" in the chart was added by author.
Wynn Quon is chief investment analyst at Legado Associates. You can send e-mail to me at wynn_quon@hotmail.com